Results from the 2021 Census has now been fully digested, crunched and released. Scan Statistics Canada's complete District of Sooke data here or follow along with this exercise in cut-and-paste (done for my own edification and ease of reference).
Context: Global
- World Population Clock ~ 8,008,919,386 (as of 3:59 PM, Jan. 2, 2023; median age 30.9 years)
- Future Population Growth (United Nations predicts 10.4 billion by 2100)
- 89.3 million people worldwide were forcibly displaced in 2021, 41% under the age 18 (UN Refugee Agency)
- 20 million people become climate refugees annually due to "increasing intensity and frequency of extreme weather events, such as abnormally heavy rainfall, prolonged droughts, desertification, environmental degradation, or sea-level rise and cyclones." (United Nations)
- Discuss: "Cheer Up: The World Is Better Off Than You Think" - New York Times, Dec. 31, 2022. <clip> "Max Roser of the indispensable website Our World in Data puts the situation exactly right: 'The world is awful. The world is much better. The world can be much better. All three statements are true at the same time.'"
Canada
- Population: 36,991,981 (up 5.2% since 2016)
- Census Mapper
- Labour Force
- Portrait of Canadian Families
- Age and Gender Pyramids
- Top 10 Municipalities
- Income in Canada 2020
- "What the Census Tells Us About Canada's Changing Population" - Globe & Mail (Feb., 2022)
- Discuss: Maximum Canada: Why 35 Million Canadians Are Not Enough - Doug Saunders + video
- "Canada's Plan for More Immigration to Boost Workforce" - CBC, Nov. 2022
British Columbia
- Population: 5,000,879 (up 7.6%)
(13.5% of national population)
- Population density per sq. km - 5.4 persons
- Province of BC Statistical Glossary
- Misc. Province of BC Statistics
- "BC Welcomes Net Migration of More than 100,000 People in 2021, The Most In 60 Years"
- "More People Moved to BC Than Anywhere Else in Canada Over the Past Year" ~ Urbanized, Oct. 2021
Capital Regional District
- Population: 397,237 (up 8.4%)
(this link includes counts for all south island municipalities and regional districts)
- CRD 1986: 275,003
- CRD 1997: 331,102
- CRD Regional Information (includes data on Agriculture, Economy, Housing, Population & Demographics,
Transportation and Census Profiles)
- Living Wage Annual Report 2022 - Greater Victoria Community Social Planning Council
- Living Wage for Families (2022)
- "Victoria Now More Expensive Place to Live Than Vancouver" ~ CBC, Nov. 17, 2022
- "Living Wage Jumps 20% in Greater Victoria" ~ Capital Daily, Nov. 2022
- What Is A Living Wage? ~ VanCity
Sooke
Population: 15,086
Increase: 16% since 2016
2001: 8,735
2006: 9,704
2011: 11,435
2016: 13,001
Draft OCP Bylaw No. 800 projections based on 2.9 percent annual growth:
- 2030: 19,511
- 2040: 25,698
- 2050: 34,561
(Editorial note: Yes, i'm horrified by those longer-term numbers too. Paradise well and truly lost unless we create a robust local economy, densify in the town centre, promote substantial mode shift away from single-occupancy vehicles and find a LRT solution to traffic congestion.)
Sooke Demographics Overview
Townfolio 2022
Stats Canada Focus on Sooke
(Data Visualizations by Topic Area)
- Population & Dwelling Counts
- Age, Sex At Birth, Gender
- Type of Dwelling
- Families, Households and Marital Status
- Income
- Language
- Housing
- Indigenous Peoples
- Immigration, Place of Birth
- Ethnocultural and Religious Diversity
- Education
- Labour
- Commuting
Sooke Age Characteristics
0-14: 2,405 (15.9%)
15-64: 9,625 (63.8%)
65+: 3,055 (20.03%)
Households
Average household size: 2.4 people
Total dwellings: 6,130
Single Family Homes: 3,820
Rentals: 1,160
Mobile homes: 355
Owners: 4,925
Renters: 1,205
Average single-family home value: $650k (2020)
Sooke single-family home sales value
(annual Victoria Real Estate Board summaries)
1995: $180,892
2003: $237,507
2009: $424,146
2010: $440,203
2015: $420,266
2018: $583,251
2020: $664,681
2021: $862,762
2022: $965,218
2023: $929,628
Greater Victoria Historical Price-Selling Graph, 1980-2021
Greater Victoria Single Family Home Sales Data, 1980-2021
Private Dwellings By Date Constructed
1960 or before ~ 440
1961 to 1980 ~ 1,485
1981 to 1990 ~ 745
1991 to 2000 ~ 740
2001 to 2005 ~ 430
2006 to 2010 ~ 740
2011 to 2015 ~ 710
2016 to 2021 ~ 840
Spending less than 30% of income on shelter costs ~ 4,780
Spending 30% or more of income on shelter costs ~ 1,325
Home owners spending more than 30% of income on shelter costs - 16.1%
Renters spending more than 30% of income on shelter costs - 44.2%
"Acceptable" housing in Sooke - 4,475 homes
Households in core need - 680
Not in core need - 5,210
"Acceptable housing identifies which thresholds the household falls below, if any. Housing that is adequate in condition, suitable in size and affordable is considered to be acceptable." Housing indicator thresholds are defined as follows: Adequate housing is reported by their residents as not requiring any major repairs; Affordable housing has shelter costs equal to less than 30% of total before-tax household income; Suitable housing has enough bedrooms for the size and composition of resident households according to the National Occupancy Standard (NOS), conceived by the Canada Mortgage and Housing Corporation and provincial and territorial representatives."
Income
Median per-person annual income: $43,200
Median after-tax income: $39,200
Number of full-time employees: 3,905
Average income: $69,600
Number of part-time employees: 3,600
Average income: $29,200
Personal Total After Tax Income (Age 15+)
Under $10,000 (including loss) ~ 935
$10,000 to $19,999 ~ 1,405
$20,000 to $29,999 ~ 2,020
$30,000 to $39,999 ~ 1,835
$40,000 to $49,999 ~ 1,665
$50,000 to $59,999 ~ 1,370
$60,000 to $69,999 ~ 975
$70,000 to $79,999 ~ 700
$80,000 to $89,999 ~ 485
$90,000 to $99,999 ~ 265
$100,000 and over ~ 490
$100,000 to $124,999 ~ 300
$125,000 and over ~ 190
Household Income
Median After-Tax Household Income: $79,500
Under $5,000 ~ 55
$5,000 to $9,999 ~ 25
$10,000 to $14,999 ~ 40
$15,000 to $19,999 ~ 105
$20,000 to $24,999 ~ 230
$25,000 to $29,999 ~ 205
$30,000 to $34,999 ~ 190
$35,000 to $39,999 ~ 230
$40,000 to $44,999 ~ 225
$45,000 to $49,999 ~ 270
$50,000 to $59,999 ~ 520
$60,000 to $69,999 ~ 490
$70,000 to $79,999 ~ 505
$80,000 to $89,999 ~ 495
$90,000 to $99,999 ~ 455
$100,000 and over ~ 2,090
which breaks down as ...
$100,000 to $124,999 ~ 880
$125,000 to $149,999 ~ 560
$150,000 and over ~ 650
- approx. __% of Sooke households earn $100k plus
- approx. __% of Sooke households earn $30k or less
Low Income Status
"Statistical units with income that is below the low-income line are considered to be in low income."
2020 benchmark: $16,550 for a single person in a community under 30,000 people
0 to 17 years ~ 250
0 to 5 years ~ 80
18 to 64 years ~ 630
65 years and over ~ 345
Citizenship
Canadian - 14,515
Non-Citizen - 460
Canada-born - 13,125
Immigrants - 1,750
Total "Visible Minority" - 775
"In 2021 Census analytical and communications products, the term "visible minority" has been replaced by the terms "racialized population" or "racialized groups", reflecting the increased use of these terms in the public sphere."
First generation Canadian - 1,995
Second generation Candian - 2,795
Third generation or more Canadian - 10,185
Mother Tongue
English - 13,730
French - 285
Other - 775
- German - 170
- Dutch - 70
- Spanish - 60
- Filipino - 55
- Arabic - 20
- Polish - 35
- Russian - 35
- Japanese - 25
- Danish - 25
- Mandarin Chinese - 25
- Punjabi - 20
- Italian - 20
- Portugese - 20
- Cantonese Chinese - 15
- Ukranian - 15
- Korean - 15
- Croatian - 10
- Afrikaans - 10
- Romanian - 10
- Hungarian - 10
- Iranian Persian - 5
- Thai - 5
Bi-and-tri lingual ~ 210
Indigenous Identity
First Nation - 520
Metis - 490
Religion
No religion and secular perspectives - 9,825
Buddhist - 504
Christian - 4,755
Hindu - 10
Jewish - 70
Muslim - 50
Sikh - 10
Traditional (North American Indigenous) spirituality - 20
Other religions and spiritual traditions - 180
Mobility Status
"Refers to the status of a person with regard to the place of residence on the reference day, May 11, 2021. Persons who have not moved are referred to as non-movers and persons who have moved from one residence to another are referred to as movers."
One year ago (2020-2021)
Non-movers - 12,805
Movers - 2,050
Five years ago (2016-2021)
Non-movers - 7,275
Movers - 6,970
Education
No high school diploma or equivalency certificate - 2,225
With high school diploma or equivalency certificate - 10,350
Post-secondary certificate, diploma or degree - 6,800
Apprenticeship or trades certificate or diploma - 1,365
College, CEGEP or other non-university certificate or diploma - 2,845
Bachelor's degree - 1,435
Master's degree - 530
Labour Force Statistics
In the labour force - 7,760
Employed - 7,240
Unemployed - 520
Not in the labour force - 4,815
Worked full year full time - 4,010
Worked part year and/or part time - 3,870
Average weeks worked in reference year - 41.3
Permanent position - 5,410
Temporary position - 825
Fixed term (1 year or more) - 330
Casual, seasonal or short-term position (less than 1 year) - 500
Self-employed - 1,410
- Agriculture, forestry, fishing and hunting - 100
- Mining, quarrying, and oil and gas extraction - 15
- Utilities - 30
- Construction - 1,045
- Manufacturing - 325
- Wholesale trade - 80
- Retail trade - 940
- Transportation and warehousing - 285
- Information and cultural industries - 80
- Finance and insurance - 170
- Real estate and rental and leasing - 85
- Professional, scientific and technical services - 560
- Management of companies and enterprises - 15
- Administrative and support, waste management and remediation services - 495
- Educational services - 600
- Health care and social assistance - 895
- Arts, entertainment and recreation - 195
- Accommodation and food services - 435
- Other services (except public administration) - 350
- Public administration - 955
Place of work
Worked at home - 1,525
Worked outside Canada - 10
No fixed workplace address - 1,455
Usual place of work - 4,250
Regular Commuting Patterns (by individual)
Sooke region - 1,415
Greater Victoria - 2,710
Elsewhere in BC - 115
Outside BC - 15
Duration of commute
Less than 15 minutes - 1,495
15 to 29 minutes - 860
30 to 44 minutes - 1,480
45 to 59 minutes - 1,085
60 minutes and over - 785
Time leaving for work
Between 5 a.m. and 5:59 a.m. - 570
Between 6 a.m. and 6:59 a.m. - 1,290
Between 7 a.m. and 7:59 a.m. - 1,360
Between 8 a.m. and 8:59 a.m. - 1,050
Between 9 a.m. and 11:59 a.m. - 625
Between 12 p.m. and 4:59 a.m. - 805
Commuting In Canada: How It Changed During COVID
Miscellaneous Other Sources
Sooke Community Health Profile (2016) ~ Public Health Services Authority
Western Communities Health Profile (2013) ~ Island Health
Context: Global
- World Population Clock ~ 8,008,919,386 (as of 3:59 PM, Jan. 2, 2023; median age 30.9 years)
- Future Population Growth (United Nations predicts 10.4 billion by 2100)
- 89.3 million people worldwide were forcibly displaced in 2021, 41% under the age 18 (UN Refugee Agency)
- 20 million people become climate refugees annually due to "increasing intensity and frequency of extreme weather events, such as abnormally heavy rainfall, prolonged droughts, desertification, environmental degradation, or sea-level rise and cyclones." (United Nations)
- Discuss: "Cheer Up: The World Is Better Off Than You Think" - New York Times, Dec. 31, 2022. <clip> "Max Roser of the indispensable website Our World in Data puts the situation exactly right: 'The world is awful. The world is much better. The world can be much better. All three statements are true at the same time.'"
Canada
- Population: 36,991,981 (up 5.2% since 2016)
- Census Mapper
- Labour Force
- Portrait of Canadian Families
- Age and Gender Pyramids
- Top 10 Municipalities
- Income in Canada 2020
- "What the Census Tells Us About Canada's Changing Population" - Globe & Mail (Feb., 2022)
- Discuss: Maximum Canada: Why 35 Million Canadians Are Not Enough - Doug Saunders + video
- "Canada's Plan for More Immigration to Boost Workforce" - CBC, Nov. 2022
British Columbia
- Population: 5,000,879 (up 7.6%)
(13.5% of national population)
- Population density per sq. km - 5.4 persons
- Province of BC Statistical Glossary
- Misc. Province of BC Statistics
- "BC Welcomes Net Migration of More than 100,000 People in 2021, The Most In 60 Years"
- "More People Moved to BC Than Anywhere Else in Canada Over the Past Year" ~ Urbanized, Oct. 2021
Capital Regional District
- Population: 397,237 (up 8.4%)
(this link includes counts for all south island municipalities and regional districts)
- CRD 1986: 275,003
- CRD 1997: 331,102
- CRD Regional Information (includes data on Agriculture, Economy, Housing, Population & Demographics,
Transportation and Census Profiles)
- Living Wage Annual Report 2022 - Greater Victoria Community Social Planning Council
- Living Wage for Families (2022)
- "Victoria Now More Expensive Place to Live Than Vancouver" ~ CBC, Nov. 17, 2022
- "Living Wage Jumps 20% in Greater Victoria" ~ Capital Daily, Nov. 2022
- What Is A Living Wage? ~ VanCity
Sooke
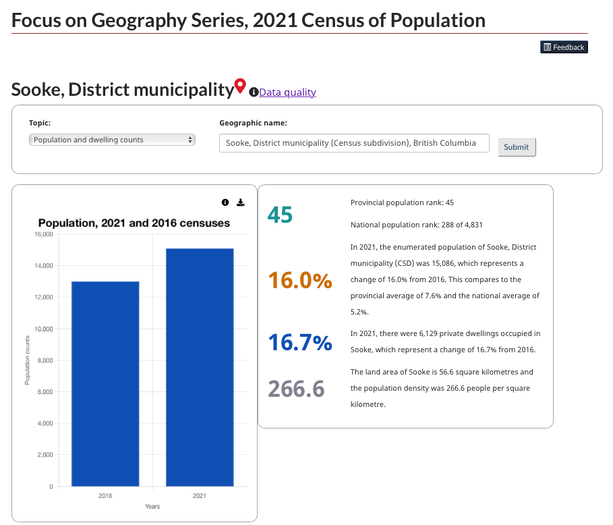
Population: 15,086
Increase: 16% since 2016
2001: 8,735
2006: 9,704
2011: 11,435
2016: 13,001
Draft OCP Bylaw No. 800 projections based on 2.9 percent annual growth:
- 2030: 19,511
- 2040: 25,698
- 2050: 34,561
(Editorial note: Yes, i'm horrified by those longer-term numbers too. Paradise well and truly lost unless we create a robust local economy, densify in the town centre, promote substantial mode shift away from single-occupancy vehicles and find a LRT solution to traffic congestion.)
Sooke Demographics Overview
Townfolio 2022
Stats Canada Focus on Sooke
(Data Visualizations by Topic Area)
- Population & Dwelling Counts
- Age, Sex At Birth, Gender
- Type of Dwelling
- Families, Households and Marital Status
- Income
- Language
- Housing
- Indigenous Peoples
- Immigration, Place of Birth
- Ethnocultural and Religious Diversity
- Education
- Labour
- Commuting
Sooke Age Characteristics
0-14: 2,405 (15.9%)
15-64: 9,625 (63.8%)
65+: 3,055 (20.03%)
Households
Average household size: 2.4 people
Total dwellings: 6,130
Single Family Homes: 3,820
Rentals: 1,160
Mobile homes: 355
Owners: 4,925
Renters: 1,205
Average single-family home value: $650k (2020)
Sooke single-family home sales value
(annual Victoria Real Estate Board summaries)
1995: $180,892
2003: $237,507
2009: $424,146
2010: $440,203
2015: $420,266
2018: $583,251
2020: $664,681
2021: $862,762
2022: $965,218
2023: $929,628
Greater Victoria Historical Price-Selling Graph, 1980-2021
Greater Victoria Single Family Home Sales Data, 1980-2021
Private Dwellings By Date Constructed
1960 or before ~ 440
1961 to 1980 ~ 1,485
1981 to 1990 ~ 745
1991 to 2000 ~ 740
2001 to 2005 ~ 430
2006 to 2010 ~ 740
2011 to 2015 ~ 710
2016 to 2021 ~ 840
Spending less than 30% of income on shelter costs ~ 4,780
Spending 30% or more of income on shelter costs ~ 1,325
Home owners spending more than 30% of income on shelter costs - 16.1%
Renters spending more than 30% of income on shelter costs - 44.2%
"Acceptable" housing in Sooke - 4,475 homes
Households in core need - 680
Not in core need - 5,210
"Acceptable housing identifies which thresholds the household falls below, if any. Housing that is adequate in condition, suitable in size and affordable is considered to be acceptable." Housing indicator thresholds are defined as follows: Adequate housing is reported by their residents as not requiring any major repairs; Affordable housing has shelter costs equal to less than 30% of total before-tax household income; Suitable housing has enough bedrooms for the size and composition of resident households according to the National Occupancy Standard (NOS), conceived by the Canada Mortgage and Housing Corporation and provincial and territorial representatives."
Income
Median per-person annual income: $43,200
Median after-tax income: $39,200
Number of full-time employees: 3,905
Average income: $69,600
Number of part-time employees: 3,600
Average income: $29,200
Personal Total After Tax Income (Age 15+)
Under $10,000 (including loss) ~ 935
$10,000 to $19,999 ~ 1,405
$20,000 to $29,999 ~ 2,020
$30,000 to $39,999 ~ 1,835
$40,000 to $49,999 ~ 1,665
$50,000 to $59,999 ~ 1,370
$60,000 to $69,999 ~ 975
$70,000 to $79,999 ~ 700
$80,000 to $89,999 ~ 485
$90,000 to $99,999 ~ 265
$100,000 and over ~ 490
$100,000 to $124,999 ~ 300
$125,000 and over ~ 190
Household Income
Median After-Tax Household Income: $79,500
Under $5,000 ~ 55
$5,000 to $9,999 ~ 25
$10,000 to $14,999 ~ 40
$15,000 to $19,999 ~ 105
$20,000 to $24,999 ~ 230
$25,000 to $29,999 ~ 205
$30,000 to $34,999 ~ 190
$35,000 to $39,999 ~ 230
$40,000 to $44,999 ~ 225
$45,000 to $49,999 ~ 270
$50,000 to $59,999 ~ 520
$60,000 to $69,999 ~ 490
$70,000 to $79,999 ~ 505
$80,000 to $89,999 ~ 495
$90,000 to $99,999 ~ 455
$100,000 and over ~ 2,090
which breaks down as ...
$100,000 to $124,999 ~ 880
$125,000 to $149,999 ~ 560
$150,000 and over ~ 650
- approx. __% of Sooke households earn $100k plus
- approx. __% of Sooke households earn $30k or less
Low Income Status
"Statistical units with income that is below the low-income line are considered to be in low income."
2020 benchmark: $16,550 for a single person in a community under 30,000 people
0 to 17 years ~ 250
0 to 5 years ~ 80
18 to 64 years ~ 630
65 years and over ~ 345
Citizenship
Canadian - 14,515
Non-Citizen - 460
Canada-born - 13,125
Immigrants - 1,750
Total "Visible Minority" - 775
"In 2021 Census analytical and communications products, the term "visible minority" has been replaced by the terms "racialized population" or "racialized groups", reflecting the increased use of these terms in the public sphere."
First generation Canadian - 1,995
Second generation Candian - 2,795
Third generation or more Canadian - 10,185
Mother Tongue
English - 13,730
French - 285
Other - 775
- German - 170
- Dutch - 70
- Spanish - 60
- Filipino - 55
- Arabic - 20
- Polish - 35
- Russian - 35
- Japanese - 25
- Danish - 25
- Mandarin Chinese - 25
- Punjabi - 20
- Italian - 20
- Portugese - 20
- Cantonese Chinese - 15
- Ukranian - 15
- Korean - 15
- Croatian - 10
- Afrikaans - 10
- Romanian - 10
- Hungarian - 10
- Iranian Persian - 5
- Thai - 5
Bi-and-tri lingual ~ 210
Indigenous Identity
First Nation - 520
Metis - 490
Religion
No religion and secular perspectives - 9,825
Buddhist - 504
Christian - 4,755
Hindu - 10
Jewish - 70
Muslim - 50
Sikh - 10
Traditional (North American Indigenous) spirituality - 20
Other religions and spiritual traditions - 180
Mobility Status
"Refers to the status of a person with regard to the place of residence on the reference day, May 11, 2021. Persons who have not moved are referred to as non-movers and persons who have moved from one residence to another are referred to as movers."
One year ago (2020-2021)
Non-movers - 12,805
Movers - 2,050
Five years ago (2016-2021)
Non-movers - 7,275
Movers - 6,970
Education
No high school diploma or equivalency certificate - 2,225
With high school diploma or equivalency certificate - 10,350
Post-secondary certificate, diploma or degree - 6,800
Apprenticeship or trades certificate or diploma - 1,365
College, CEGEP or other non-university certificate or diploma - 2,845
Bachelor's degree - 1,435
Master's degree - 530
Labour Force Statistics
In the labour force - 7,760
Employed - 7,240
Unemployed - 520
Not in the labour force - 4,815
Worked full year full time - 4,010
Worked part year and/or part time - 3,870
Average weeks worked in reference year - 41.3
Permanent position - 5,410
Temporary position - 825
Fixed term (1 year or more) - 330
Casual, seasonal or short-term position (less than 1 year) - 500
Self-employed - 1,410
- Agriculture, forestry, fishing and hunting - 100
- Mining, quarrying, and oil and gas extraction - 15
- Utilities - 30
- Construction - 1,045
- Manufacturing - 325
- Wholesale trade - 80
- Retail trade - 940
- Transportation and warehousing - 285
- Information and cultural industries - 80
- Finance and insurance - 170
- Real estate and rental and leasing - 85
- Professional, scientific and technical services - 560
- Management of companies and enterprises - 15
- Administrative and support, waste management and remediation services - 495
- Educational services - 600
- Health care and social assistance - 895
- Arts, entertainment and recreation - 195
- Accommodation and food services - 435
- Other services (except public administration) - 350
- Public administration - 955
Place of work
Worked at home - 1,525
Worked outside Canada - 10
No fixed workplace address - 1,455
Usual place of work - 4,250
Regular Commuting Patterns (by individual)
Sooke region - 1,415
Greater Victoria - 2,710
Elsewhere in BC - 115
Outside BC - 15
Duration of commute
Less than 15 minutes - 1,495
15 to 29 minutes - 860
30 to 44 minutes - 1,480
45 to 59 minutes - 1,085
60 minutes and over - 785
Time leaving for work
Between 5 a.m. and 5:59 a.m. - 570
Between 6 a.m. and 6:59 a.m. - 1,290
Between 7 a.m. and 7:59 a.m. - 1,360
Between 8 a.m. and 8:59 a.m. - 1,050
Between 9 a.m. and 11:59 a.m. - 625
Between 12 p.m. and 4:59 a.m. - 805
Commuting In Canada: How It Changed During COVID
Miscellaneous Other Sources
Sooke Community Health Profile (2016) ~ Public Health Services Authority
Western Communities Health Profile (2013) ~ Island Health
 RSS Feed